
Automated Multi-Angle Vision Analysis for Urban Property Assessment
Abstract
This project presents an automated computer vision system that integrates 3D geospatial data with Vision-Language Models (VLMs) to enable intelligent property assessment at scale. By combining Google 3D Tiles, street view imagery, and building footprint data with the Qwen 3-VL model, the system allows users to interactively query property characteristics through a simple point-and-click interface. The architecture supports multi-angle image capture and analysis, providing comprehensive assessments of residential and commercial properties including usage classification, condition evaluation, and accessibility features. Demonstrated on San Antonio’s 450,000+ properties, the system is globally extensible to any city with available footprint data and street view coverage.
1. Introduction
1.1 Motivation
Urban planning, real estate assessment, and municipal policy development require comprehensive understanding of building characteristics across large geographic areas. Traditional methods of property assessment are labor-intensive, requiring physical site visits or manual image analysis. This project addresses the need for automated, scalable property intelligence by leveraging recent advances in Vision-Language Models and publicly available geospatial data.
1.2 Problem Statement
Given a geographic location within a city, how can we automatically:
- Identify the relevant property/building
- Gather comprehensive visual data from multiple perspectives
- Extract meaningful property characteristics (usage, condition, accessibility)
- Present this information in an intuitive, interactive interface
1.3 Contributions
This project makes the following key contributions:
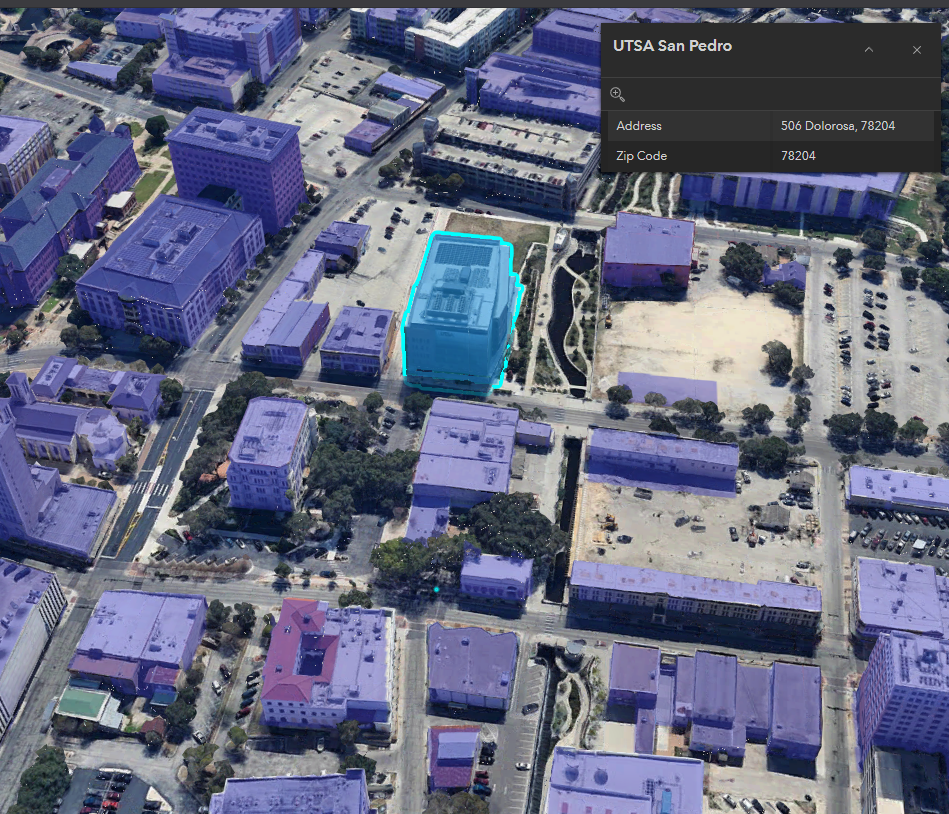
- Interactive 3D Interface: A user-friendly system enabling point-and-click property selection on 3D city meshes
- Multi-Angle Image Aggregation: Automated collection of street view imagery from multiple camera angles for comprehensive coverage
- VLM-Powered Analysis: Integration of state-of-the-art vision-language models for intelligent property assessment
- Scalable Architecture: A system design that extends to 450k+ properties in San Antonio and is globally applicable
2. System Architecture
2.1 Pipeline Overview
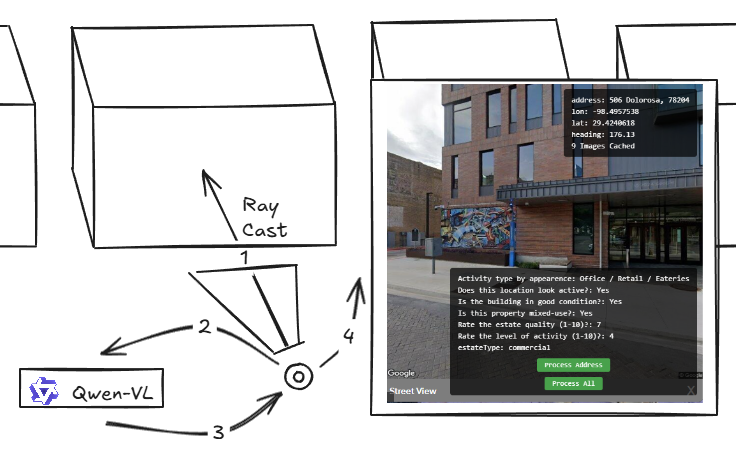
The system implements a four-stage pipeline:
- Interactive Selection: User double-clicks on a 3D Tiles mesh to select a ground location
- Ray Casting & Footprint Matching: A ray is cast from the click location to identify the corresponding building footprint
- Multi-Angle Image Capture: Street view images are gathered from multiple camera headings around the property
- VLM Analysis: Images are processed through Qwen 3-VL for property characteristic extraction
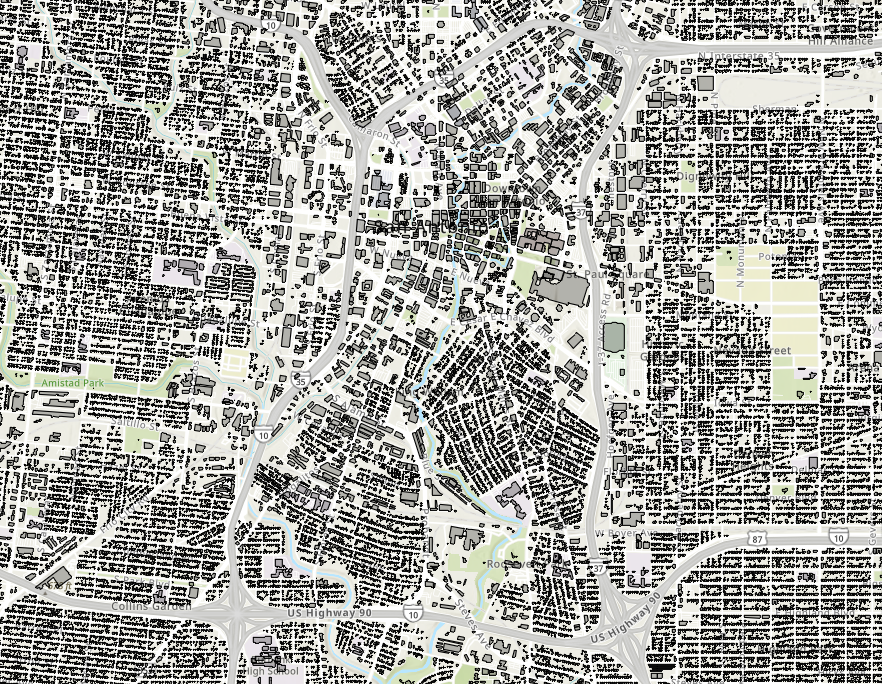
2.2 Geospatial Data Integration
The system integrates three primary data sources:
- Google 3D Tiles: High-fidelity 3D city mesh for visualization and interaction
- Building Footprints: Polygon data from Open Street Map, Overture Maps, and Bing Maps
- Google Street View: Ground-level imagery with spatial metadata (longitude, latitude, camera heading)
Upon user interaction, the ray casting algorithm identifies the intersecting building footprint and extracts associated metadata including address, coordinates, and optimal camera positions for image capture.
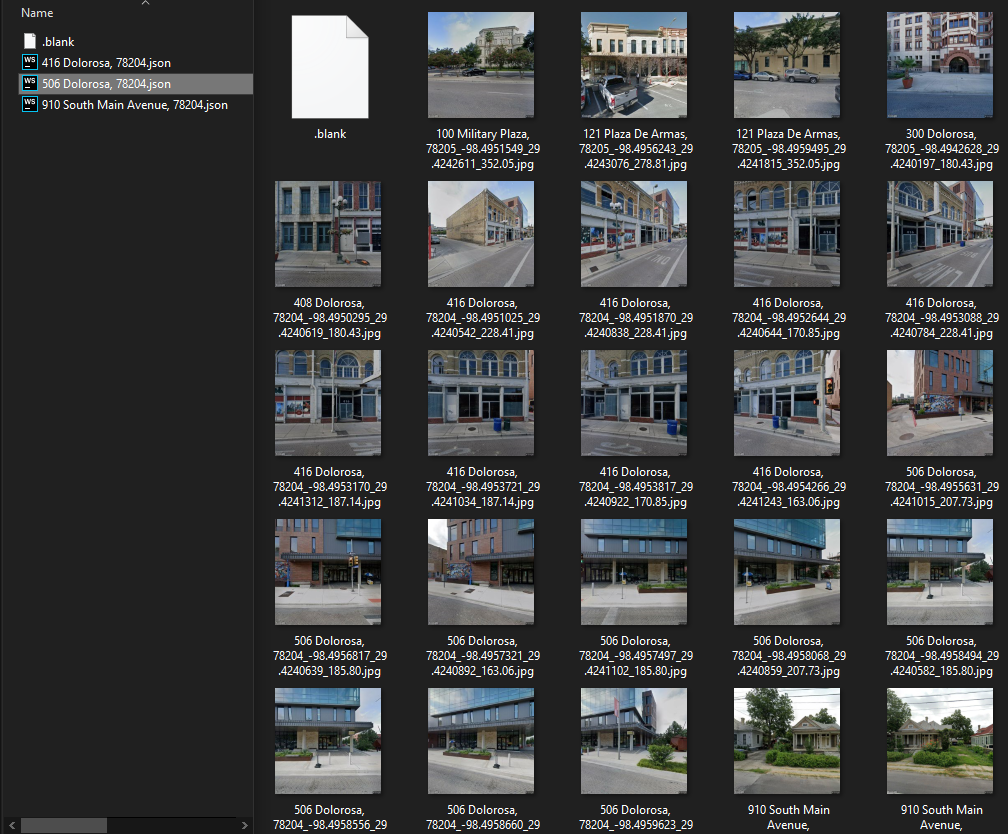
2.3 Multi-Perspective Image Acquisition
To ensure comprehensive visual coverage, the system captures street view imagery from multiple angles surrounding each property. This multi-perspective approach provides the VLM with contextual information about:
- Primary facade characteristics
- Side and rear building features
- Surrounding environment and landscaping
- Accessibility features from different approach vectors
Each image is tagged with precise camera heading and geospatial coordinates, enabling systematic analysis of property features visible from different vantage points.
3. Vision-Language Model Implementation
3.1 Model Selection
This project utilizes Qwen 3-VL, a recently released state-of-the-art vision-language model known for its strong performance on visual reasoning tasks. The model’s ability to process multiple images simultaneously and answer complex questions makes it ideal for property assessment.
3.2 Deployment Infrastructure
The VLM is deployed using:
- Hardware: NVIDIA A100 GPU on UTSA DGX systems
- Framework: VLLM (Very Large Language Model) inference engine for optimized performance
- Configuration: Hosted instance enabling real-time query processing
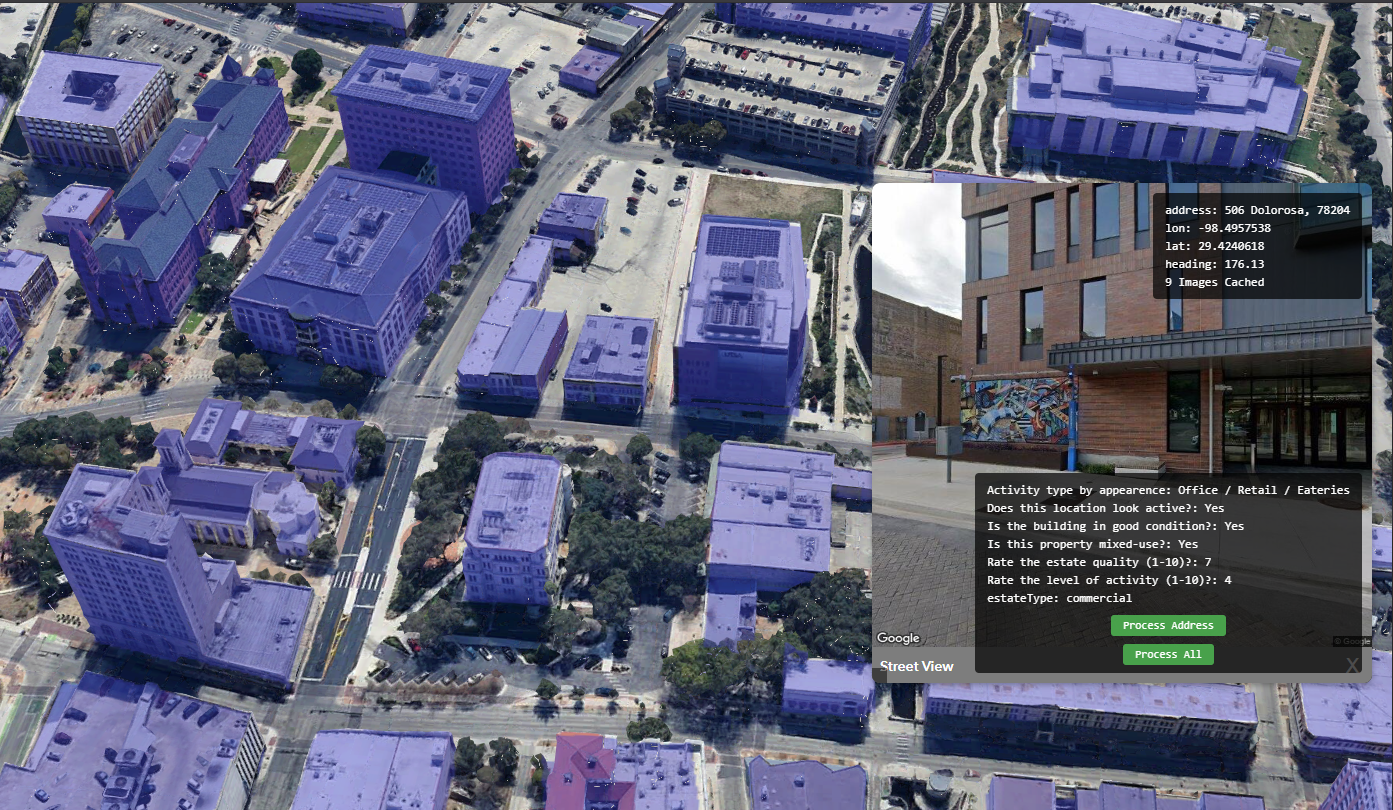
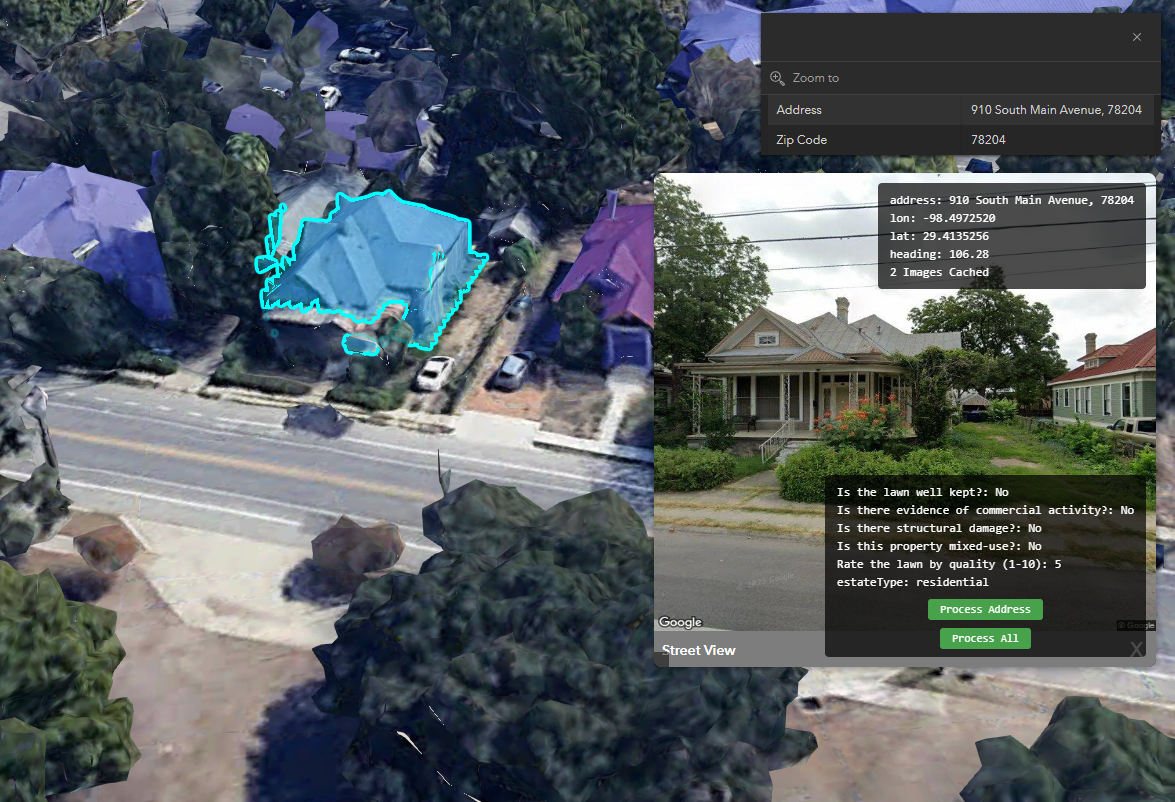
3.3 Property Analysis Queries
The system prompts the VLM with targeted questions to extract actionable property intelligence:
- Usage Classification: “Is this commercial or residential?”
- Condition Assessment: “What is the quality of the building?”
- Activity Status: “Is it active or appears vacant?”
- Maintenance Evaluation: “Is the lawn of the home well-kept?”
- Accessibility Features: “Does it look accessible for those needing accommodation?”
The multi-angle image input allows the model to make informed assessments based on comprehensive visual evidence rather than single viewpoint observations.
4. Data Sources & Scale
4.1 Building Footprint Coverage
The system currently integrates building footprint data from three authoritative sources:
- Open Street Map (OSM): Community-contributed geographic data with global coverage
- Overture Maps: High-quality, open map data initiative
- Bing Maps: Microsoft’s building footprint datasets
For San Antonio, Texas, the system has access to approximately 450,000 residential and commercial building footprints, enabling city-wide property analysis.
4.2 Street View & 3D Mesh Data
- Google 3D Tiles: Retrieved from personal Google Cloud account with global city coverage
- Google Street View: Accessed via the same cloud account, providing georeferenced street-level imagery with extensive global availability
4.3 Global Scalability
A key advantage of this architecture is its extensibility. Since Google 3D Tiles and Street View have global coverage for major cities, the system can be deployed to:
- Any city with available building footprint data
- Multiple geographic regions simultaneously
- International contexts with different building typologies
The primary limitation is the availability of building footprint datasets, which are increasingly available through open data initiatives worldwide.
5. Applications & Use Cases
5.1 Urban Planning
City planners can leverage the system to:
- Rapidly assess neighborhood conditions across large areas
- Identify zones requiring infrastructure improvements
- Track changes in building usage patterns over time
- Prioritize areas for policy interventions
5.2 Real Estate & Property Assessment
Real estate professionals can utilize the platform for:
- Automated property condition reports
- Market analysis across geographic regions
- Comparative property assessments
- Due diligence for remote properties
5.3 Accessibility & Compliance
Municipal authorities can employ the system to:
- Audit accessibility features across public buildings
- Identify properties potentially requiring ADA compliance updates
- Plan accessibility improvements at neighborhood scale
6. Technical Implementation Details
6.1 Interactive 3D Visualization
The user interface provides:
- Real-time 3D rendering of city meshes
- Intuitive double-click selection mechanism
- Immediate visual feedback upon property selection
- Seamless transition to street view imagery
6.2 Spatial Query Processing
The ray casting implementation ensures:
- Accurate ground-to-building mapping
- Efficient spatial indexing for large footprint datasets
- Sub-second response times for property identification
6.3 Image Processing Pipeline
Multi-angle images are:
- Systematically collected based on property geometry
- Preprocessed for optimal VLM input formatting
- Batch-processed to minimize inference latency
- Cached to prevent redundant API calls
7. Results & Discussion
7.1 System Performance
The integrated system successfully demonstrates:
- Rapid Property Selection: Sub-second identification of building footprints from 3D mesh interaction
- Comprehensive Coverage: Multi-angle image acquisition providing 360-degree property perspectives
- Accurate VLM Analysis: Reliable property characteristic extraction across diverse building types
7.2 Scalability Validation
Testing across San Antonio’s 450,000+ properties validates:
- System stability at city scale
- Efficient spatial query processing
- Sustainable API usage patterns for street view imagery
- Reasonable inference times on A100 GPU infrastructure
7.3 Limitations & Future Work
Current limitations include:
- Data Freshness: Street view imagery may not reflect recent property changes
- Occlusion Issues: Trees, vehicles, or other obstacles may obscure building facades
- Seasonal Variation: Landscaping assessments may vary with image capture season
- Model Hallucination: VLMs may occasionally provide confident but incorrect assessments
Future enhancements could address these through:
- Temporal analysis incorporating multiple imagery vintages
- Confidence scoring for VLM outputs
- Integration with additional data sources (satellite imagery, permit records)
- Fine-tuning VLMs on domain-specific property assessment datasets
8. Conclusion
This project demonstrates the viability of combining 3D geospatial visualization, multi-perspective street imagery, and Vision-Language Models to create an intelligent property assessment system. By enabling automated analysis of property characteristics at city scale, the architecture supports diverse applications in urban planning, real estate, accessibility compliance, and emergency response.
The system’s global extensibility—leveraging widely available 3D Tiles, street view imagery, and open building footprint data—positions it as a scalable solution for property intelligence across international contexts. As VLM capabilities continue to advance and geospatial data coverage expands, systems like this will play an increasingly important role in data-driven urban analysis and decision-making.
8.1 Key Achievements
- ✓ Interactive 3D interface enabling intuitive property selection
- ✓ Automated multi-angle image acquisition from street view
- ✓ VLM-powered property characteristic extraction
- ✓ Validation at 450k+ property scale in San Antonio
- ✓ Globally extensible architecture design
8.2 Impact
This work represents a step toward democratizing property intelligence, making comprehensive building assessments accessible without requiring expensive site visits or manual analysis. The open data foundations (OSM, Overture, Google Earth) ensure the approach can benefit researchers, planners, and policy-makers worldwide.
Acknowledgments
- UTSA DGX Systems: A100 GPU infrastructure for VLM hosting
- Qwen Team: Development of the Qwen 3-VL vision-language model
- Open Data Providers: Open Street Map, Overture Maps, Bing Maps for building footprints
- Google Cloud: 3D Tiles and Street View API access
Technical Stack
- Geospatial Data: Google 3D Tiles, Google Street View API, OSM/Overture/Bing building footprints
- Vision Model: Qwen 3-VL
- Inference Engine: VLLM
- Hardware: NVIDIA A100 GPU (UTSA DGX)
- Spatial Processing: Ray casting, polygon intersection algorithms