
US-UrbanLST: Large-Scale Land Surface Temperature Dataset
Abstract
Land Surface Temperature (LST) serves as a critical indicator for quantifying urban heat islands and informing climate-resilient urban planning strategies, particularly for vulnerable communities. However, the lack of open-source, well-organized, large-scale, and spatio-temporal datasets poses significant challenges to comprehensive research at the national scale across the United States. To fill this gap, we present US-UrbanLST, a large-scale open-source dataset consisting of historical LST measurements and a comprehensive set of key auxiliary environmental factors (NDBI, NDVI, NDWI, Albedo, DEM, LCZ, and RGB) for 124 U.S. cities at 30m spatial resolution spanning 2013-2025. To showcase applications, we develop advanced LST forecasting baselines using Earthformer and CNN+LSTM architectures, and an LLM-driven web application (UrbanCast) that translates model predictions into actionable planning guidance. 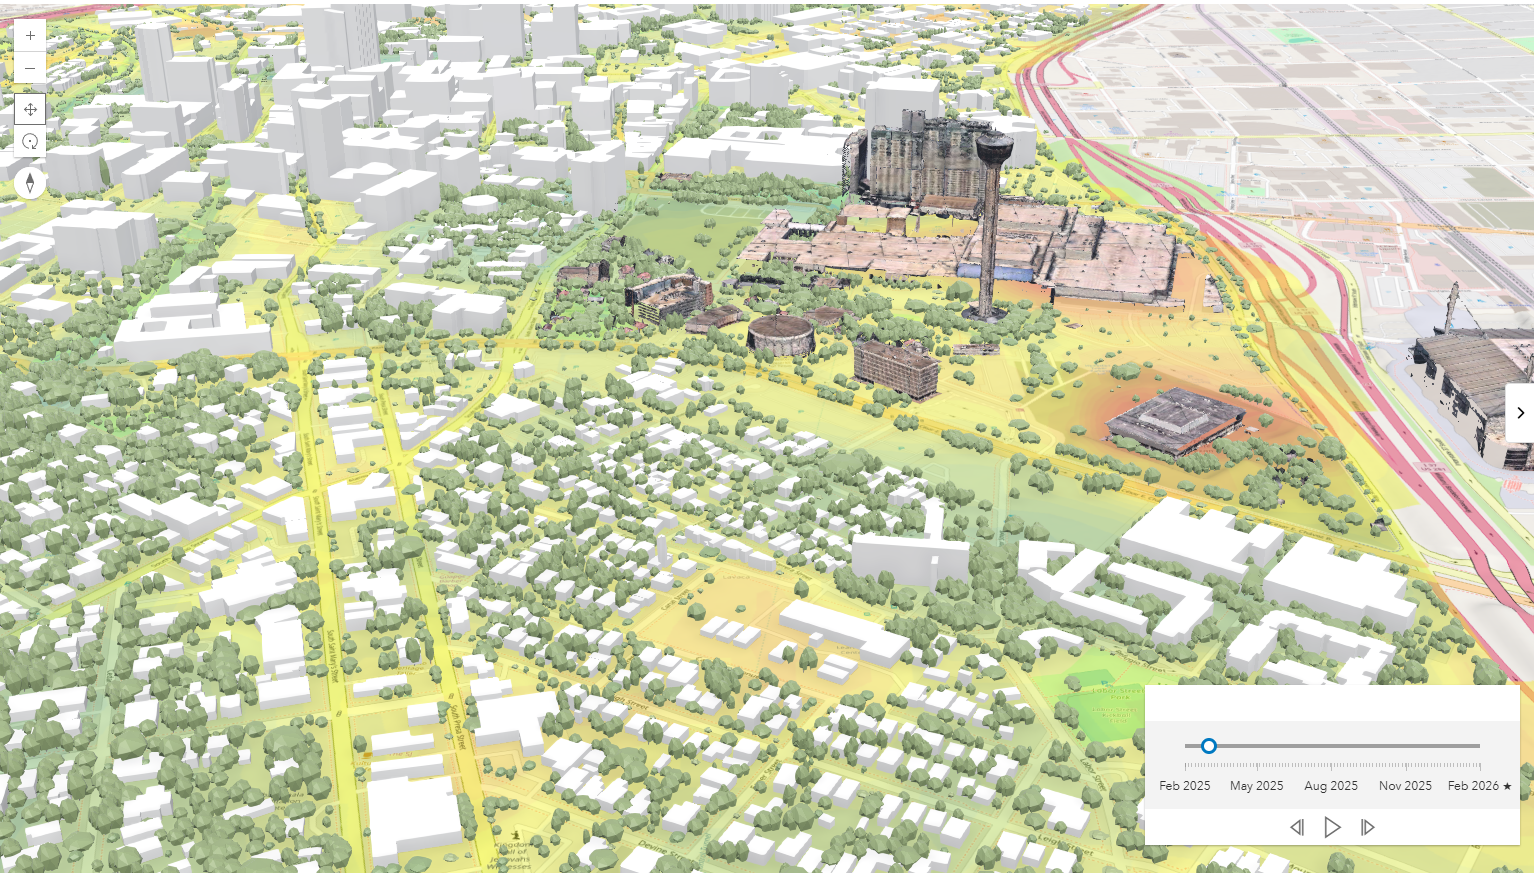 GitHub: https://github.com/JesseGuerrero/US-UrbanLST
1. Introduction
1.1 Motivation
Timely and granular information on Land Surface Temperature plays a key role in enhancing resilience to climate disasters. It can help enhance public transportation and energy planning by informing infrastructure maintenance, inspection, upgrades, public awareness initiatives, and emergency management, contributing to advancing the UN Sustainable Development Goal #13 Climate Action.
Despite growing interest in applying data-driven approaches in this domain, the lack of open-source, large-scale, granular, spatio-temporal, national data on LST and relevant factors introduces major obstacles to comprehensive research across the United States. Most existing research focuses on only 1-3 cities per study, and the few investigations encompassing 100+ urban areas have critical limitations: they don’t cover the U.S., have coarse spatial resolution, or are not publicly available.
1.2 Problem Statement
Existing LST datasets and studies suffer from three key limitations:
- Geographic Gap: Many large-scale datasets do not cover U.S. urban areas and contain region-specific variables that resist global standardization
- Resolution: Datasets covering 100+ urban areas typically operate at coarse 1km resolution, insufficient for seeing local hotspots
- Accessibility: Many datasets and code implementations remain closed-source, impeding reproducibility
1.3 Contributions
- First Open-Source U.S. LST Benchmark: Large-scale, granular LST dataset for 124 U.S. cities at 30m resolution
- Comprehensive Environmental Factors: 9 input channels including NDVI, NDWI, NDBI, Albedo, DEM, LCZ, and RGB
- Forecasting Baselines: Earthformer and CNN+LSTM models for spatio-temporal LST prediction
- UrbanCast Application: LLM-driven chatbot translating forecasts into actionable urban planning guidance
2. Dataset
2.1 Data Acquisition and Processing
The pipeline collects high-resolution data on LST and related environmental factors for 124 cities across the United States. Urban boundaries from Esri geospatial footprints are used with the SpatioTemporal Asset Catalog (STAC) API for data collection. For each urban area, multispectral Landsat 8 observations spanning 2013-2025 are acquired, complemented by Digital Elevation Model products. The imagery undergoes spatial preprocessing including geometric rectification, mosaicking, and coordinate transformation, followed by geophysical transformation algorithms to derive environmental indices.
2.2 Collected Factors
Each factor is included as a separate channel in the dataset:
- Land Surface Temperature (LST): From Landsat 8 TIRS Level 2 Collection 2, an advanced operational thermal product with atmospheric correction
- NDVI: Vegetation density indicator with an established inverse relationship to LST
- NDWI: Water presence indicator, where increasing NDWI correlates with decreasing LST
- NDBI: Built-up environment indicator with a positive correlation to LST through reduced humidity and increased heated surfaces
- Surface Albedo: Ratio of reflectance (0-1) with high correlation to surface temperature
- RGB Values: Raw red, green, blue channels from Landsat bands in [0,1] range
- Local Climate Zones (LCZ): 17-class standardized framework categorizing land types based on heat characteristics
- Digital Elevation Model (DEM): Elevation above sea level at 30m resolution, inversely correlated with surface temperature
2.3 Data Characteristics
| Attribute | Value |
|---|---|
| Spatial Resolution | 30 meters |
| Tile Size | 128 x 128 pixels (3.84 km^2) |
| Input Channels | 9 |
| Output Channel | 1 (LST) |
| Total Rasters | ~1.4 million tiles |
| Storage Size | ~150 GB |
| Temporal Coverage | 2013-2025 |
| Cities | 124 U.S. cities |
3. LST Forecasting
3.1 Models
Two architectures were developed and evaluated:
- Earthformer: A spatio-temporal transformer-based model capable of modeling short-term and long-term temporal associations and spatial correlations via cuboid attention mechanisms
- CNN+LSTM: A combined Convolutional Neural Network and Long Short-Term Memory architecture designed to capture spatio-temporal relationships
3.2 Experimental Setup
Models use 9 channels per month across 12-month input sequences. Linear interpolation handles missing monthly observations, and data augmentation (rotation, mirroring) is applied on training data. The temporal split strategy divides the dataset chronologically: training (2013-2021), validation (2022-2023), and testing (2024-2025).
3.3 Results
Performance (RMSE) across Land Cover Zone clusters:
| Land Cluster | LCZ | Description | Earthformer | CNN+LSTM |
|---|---|---|---|---|
| All | 0-17 | All Lands | 13.93 | 18.75 |
| 1 | 1-3 | Dense buildings, sparse green space | 22.82 | 15.52 |
| 2 | 4-6 | Less dense buildings, more green space | 15.14 | 19.48 |
| 3 | 7-10 | Remaining urban classes | 12.59 | 14.42 |
| 4 | 11-17,0 | Natural landscapes | 11.84 | 17.61 |
3.4 Ablation Study
| Feature Set | Earthformer | CNN+LSTM |
|---|---|---|
| All | 13.93 | 18.75 |
| LST Only | 14.67 | 19.96 |
| Spectral (no LST) | 13.89 | 22.44 |
| RGB Only | 15.62 | 26.68 |
The results confirm the value of the processed auxiliary factors and the importance of historical LST data for forecasting.
4. UrbanCast: LLM-Driven Application
A case study in San Antonio, TX demonstrates the forecasting framework’s applicability. The transformer model generates anchor-day predictions for the upcoming month, which are extended into complete daily sequences using a constrained anomaly method with historical climatology. An analog ensemble captures uncertainty by selecting past years with similar conditions.
These outputs are integrated into a chatbot interface. For example, when queried about downtown San Antonio during the second week of next month, the chatbot responds with predicted temperatures, confidence intervals relative to historical averages, and actionable recommendations such as adjusted outdoor work schedules and cooling station deployment.
5. Research Directions
US-UrbanLST enables several previously constrained research pathways:
- High-Accuracy LST Forecasting: The complexity of the dataset calls for novel AI-driven solutions with cross-city generalizability
- Equity-Centered Heat Vulnerability Assessment: 30m resolution enables block-level analysis of thermal exposure disparities correlated with socioeconomic indicators
- Digital Twin Integration: Monthly temporal resolution supports what-if scenario modeling for urban planning interventions
- Climate Adaptation Planning: Cross-city training produces models applicable to cities lacking historical thermal monitoring
- Pre-Training for Foundation Models: Derived thermal indices alongside LST position the dataset as both a pre-training corpus and a downstream benchmark
6. Conclusion
US-UrbanLST is the first open-source, large-scale, granular LST dataset for the United States, covering 124 cities with 9 environmental channels at 30m resolution from 2013-2025. The experimental results demonstrate the complex nature of LST patterns that challenge current advanced AI models, while the ablation study confirms the importance of the collected auxiliary factors. The UrbanCast application demonstrates how AI-driven forecasts can be translated into accessible, actionable guidance for city stakeholders.
Acknowledgments
- UTSA: High Performance Computing Platform (HPC Slurm), specialized GPU servers, and dedicated workstations
- Co-authors: Leon Najafirad, Isaac Corley (Wherobots), Maryam Tabar, Paul Rad
Technical Stack
- Satellite Data: Landsat 8/9 Level 2 Collection 2 via STAC API
- Spatial Processing: Esri urban boundaries, geometric rectification, mosaicking
- Models: Earthformer (spatio-temporal transformer), CNN+LSTM
- Infrastructure: UTSA HPC Slurm Platform, GPU servers
- Dataset Hosting: HuggingFace
- Application: LLM-driven chatbot (UrbanCast)